Most people think reports are just static documents. They’re not. Every dataset you collect, every AI log, every business metric hides something valuable. A pattern, a trend and insight.
That’s where Manus report analysis modes come in.
They don’t just summarize data, they transform raw numbers into actionable intelligence enabling developers, analysts and businesses to make smarter, faster decisions.
Whether you’re tracking AI performance monitoring IoT systems or analyzing business KPIs Manus reports provide the clarity and insight that static reports can’t deliver.
What Is a Manus Report?
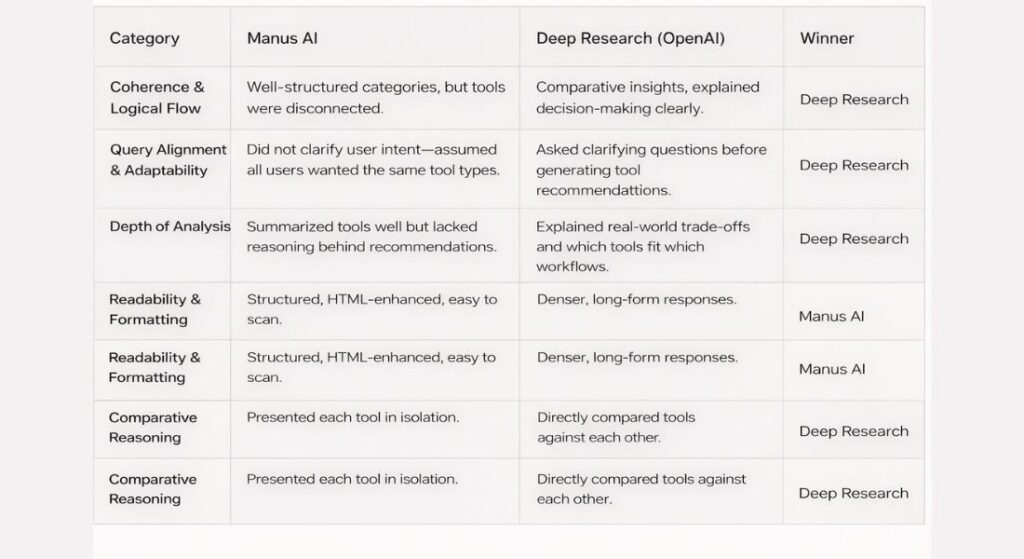
Manus Report Analysis Modes Comparison
Think of a Manus report as a lens into your data. It organizes information from AI outputs system logs, operational dashboards or business metrics but it doesn’t stop at storing numbers. Manus reports structure data intelligently highlighting trends and allow you to analyze, compare and even predict outcomes.
Without Manus reports insights remain hidden in spreadsheets or scattered dashboards making decision making slower and less accurate. For beginners a Manus report feels like a powerful reporting system that surfaces trends you didn’t know existed.
For experienced developers and analysts it becomes a core tool for workflow automation performance monitoring and data driven strategy.
Visual Example: Imagine a dashboard combining live system logs, AI performance metrics and sales data into a single interactive chart. Alerts update in real time on one side historical trends appear on another and predictive insights are displayed at the top giving you a complete picture at a glance.
Why Manus Report Analysis Modes Matter?
Reports aren’t just numbers, they tell a story. Manus report analysis modes reveal patterns, forecast trends and provide actionable intelligence that helps developers and businesses make decisions confidently.
Using the right analysis mode ensures that you can track system health as it happens, compare performance across periods, predict outcomes with AI-driven analytics and customize reports to examine deep module specific insights.
Incorrectly structured reports can bury these insights. Manus analysis modes ensure that your data is not only readable but also interpretable and actionable so you’re always empowered to make the right choices.
The Five Manus Report Analysis Modes
Real-Time Mode processes data instantly making it ideal for live dashboards AI monitoring and IoT systems. This mode allows teams to respond immediately to anomalies, system errors or performance fluctuations.
For example monitoring an AI powered e-commerce chatbot becomes straightforward when you can track query volumes, response latencies and user sentiment in real time. Developers can integrate live feeds using WebSockets or APIs to update dashboards dynamically ensuring no critical insight is missed.
Batch Mode processes data at scheduled intervals making it perfect for historical reporting or analysis of large datasets. Teams can schedule weekly, daily or monthly reports without overloading the system.
For instance an Amazon storefront can automatically compile all customer order logs at midnight and generate a report for analysis the following day. Batch Mode balances system performance and efficiency enabling accurate reporting without slowing down operations.
Comparative Mode allows users to examine data trends over time. This mode is especially useful for evaluating AI model performance or business metrics across quarters or months. Developers and analysts can visualize improvements, anomalies or stagnation making it easier to identify actionable trends.
Comparative Mode brings clarity to complex datasets and supports decisions based on actual performance rather than assumptions.
Predictive Mode leverages AI and machine learning algorithms to forecast future trends based on historical Manus reports. Businesses can anticipate sales spikes, system load increases or resource requirements before they occur.
Teams can gather historical data train models and visualize predictions on dashboards triggering automated alerts when certain thresholds are expected to be exceeded. This proactive approach prevents bottlenecks and helps optimize both operational and strategic decisions.
Manual Analysis Mode provides total control for deep customized exploration of data. Analysts and developers can apply complex queries, integrate multiple data sources or create specialized dashboards using Power BI Grafana or custom interfaces.
For example server logs for a SaaS platform can be filtered and analyzed by specific parameters enabling teams to uncover subtle patterns that automated modes might miss. Manual Mode ensures flexibility for enterprise level reporting and advanced analysis.
The Five Manus Report Analysis Mode
Manus Report Analysis Modes Comparison
| Mode | Purpose | Use Case | Key Advantage | Example / Command |
| Real-Time Mode | Processes data instantly | Live dashboards AI monitoring IoT systems | Immediate insights triggers automation | const dataStream = new WebSocket(“wss://api.manusreport/live”); dataStream.onmessage = (event) => { const reportData = JSON.parse(event.data); updateDashboard(reportData); }; |
| Batch Mode | Processes data in scheduled intervals | Daily weekly or monthly logs | Reduces server load handles large datasets | Automated report generation at midnight for e-commerce logs |
| Comparative Mode | Compares datasets over time | Quarterly performance AI model evaluation | Highlights trends improvements and anomalies | Visualize with Chart.js or Recharts for KPI comparison |
| Predictive Mode | Forecasts future trends using AI/ML | Sales predictions system load forecasting | Enables proactive decisions | ML algorithms on historical reports + dashboard alerts |
| Manual Analysis Mode | Deep custom queries and filters | Enterprise dashboards custom analytics | Full control for advanced users | SELECT server_id AVG(response_time) FROM system_logs WHERE timestamp BETWEEN ‘2025-09-01’ AND ‘2025-10-01’ GROUP BY server_id; |
Wide Research Mode – Parallel Analysis for Large-Scale Insights
For teams handling research-intensive tasks Manus supports parallel analysis by running multiple agents simultaneously. Each agent tackles a different aspect of your dataset—sales trends system metrics or AI logs—and then synthesizes the findings into a single report. This accelerates research and provides deeper insights reducing hours of manual analysis to minutes. Use it when you need fast comprehensive overviews without manually aggregating multiple datasets.
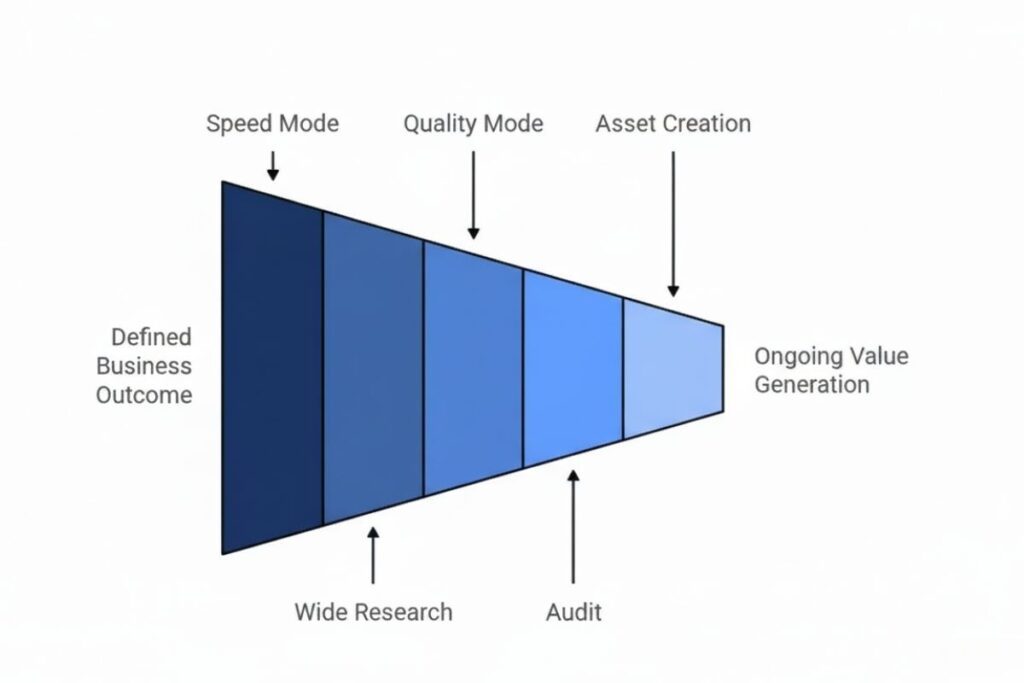
Choosing the Right Mode for Your Task
While each Manus mode has a specific purpose choosing the right mode depends on your workflow:
- Real Time Mode – for immediate monitoring and quick responses.
- Batch Mode – for scheduled reports and historical analysis.
- Comparative Mode – for spotting trends across time periods.
- Predictive Mode – for forecasting and proactive decision-making.
- Manual Mode – for deep custom analysis.
For complex projects teams often combine modes: start with Batch or Comparative for context then use Predictive or Manual for deeper insights. This hybrid approach ensures both efficiency and accuracy without adding extra steps.
How Manus Report Analysis Transforms Workflows
- Developers: Monitor AI performance, automate dashboards and detect anomalies faster.
- Businesses: Compare quarterly sales trends, optimize inventory and predict customer demand.
- Analysts: Extract insights from massive datasets without manual data crunching.
- Educators & Researchers: Analyze learning or experimental data efficiently.
Visual Mockup Idea: Multi-panel dashboard combining real time alerts, historical trends and predictive forecasts.
How Manus Report Analysis Transforms Workflows
Manus reports aren’t just technical tools, they change the way organizations operate. Developers can monitor AI systems, automate dashboards and detect anomalies more quickly. Businesses can track quarterly sales trends, optimize inventory and predict customer demand before it happens.
Analysts can extract meaningful insights from massive datasets without spending hours on manual data processing. Researchers and educators can study experimental data efficiently uncovering trends that would otherwise remain hidden.
Visual Mockup Idea: Imagine a multi panel dashboard combining real time alerts, historical performance graphs and predictive forecasts. This setup allows stakeholders at every level to make informed decisions instantly.
Why Developers & Businesses Should Care
Manus reports are benchmark-proven seamlessly integrating with AI workflows and low-code automation tools like n8n. They are user-oriented, executing tasks and delivering insights efficiently.
Their flexibility allows for real time monitoring, batch processing trend analysis and predictive forecasting. Moreover they are scalable handling both small datasets and enterprise-level reporting without performance degradation.
Conclusion
Manus report analysis modes are more than just reporting tools, they’re your window into smarter workflows. They let you transform raw data into insights that actually drive decisions.
Whether you’re monitoring AI systems in real time analyzing quarterly performance or forecasting future outcomes these modes empower teams to act with confidence. Start exploring each mode today and experience how actionable insights can transform your workflow.c
FAQs
What is the main purpose of Manus report analysis modes?
They convert raw data into actionable insights helping developers and businesses monitor, compare and forecast outcomes efficiently. Each mode addresses a specific analysis need.
Which Manus mode is best for live monitoring?
Real Time Mode is ideal for dashboards, AI systems and IoT monitoring. It delivers instant feedback and triggers automated responses immediately.
Can Manus reports forecast future trends accurately?
Yes Predictive Mode leverages AI/ML algorithms to project sales system load or other key metrics. Accuracy improves with high quality historical data.
Are Manus reports suitable for enterprise customization?
Absolutely. Manual Analysis Mode allows deep custom queries, dataset integrations and connections with visualization tools like Power BI and Grafana.
How do Manus reports integrate with workflow tools?
They integrate via WebSockets APIs or low code platforms like n8n enabling automated workflows, real time updates and visualization directly in dashboards.