
A Cause and Effect Graphic Organizer is a visual tool that helps people understand how events, actions or ideas are connected. It is widely used in education to analyze reading passages, science experiments, historical events and in business to identify reasons behind successes or failures.
There are several types of organizers for different purposes: a T-chart shows simple cause effect pairs a Fishbone diagram explores multiple causes for one effect Flowcharts map step by step sequences and Venn diagrams compare shared or distinct effects.
Using these organizers improves critical thinking, comprehension and decision making, making complex relationships easier to understand.
Why Use a Cause and Effect Graphic Organizer?
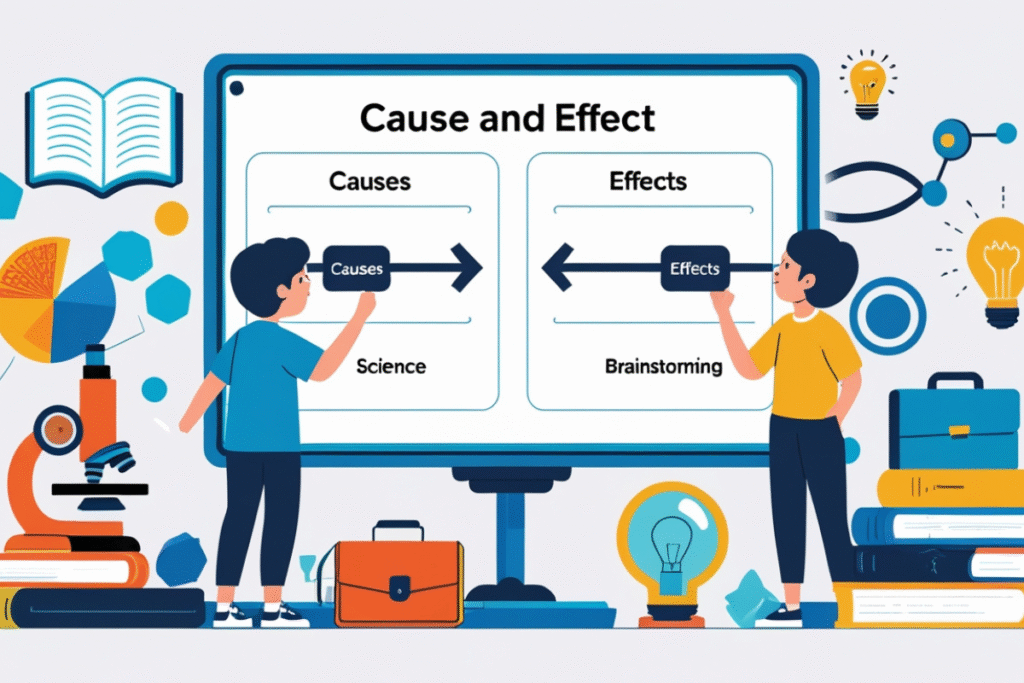
A cause and effect graphic organizer helps simplify complex information by visually showing how one event leads to another. It is widely used in education, business and research for better understanding and analysis.
Key Benefits:
- Improves comprehension: Students can easily identify causes and effects in stories, historical events or science experiments.
- Enhances critical thinking: Helps learners analyze relationships between actions and outcomes.
- Supports problem solving: In business or research it identifies reasons behind successes, failures or unexpected results.
- Organizes information clearly: Makes notes, essays and presentations more structured.
- Encourages decision making: By visualizing outcomes users can plan actions more effectively.
Example Use Cases:
- Classroom: Mapping causes of the American Revolution or effects of pollution on the environment.
- Business: Analyzing causes of declining sales and planning corrective strategies.
- Research: Tracking variables in a scientific experiment to determine outcomes.
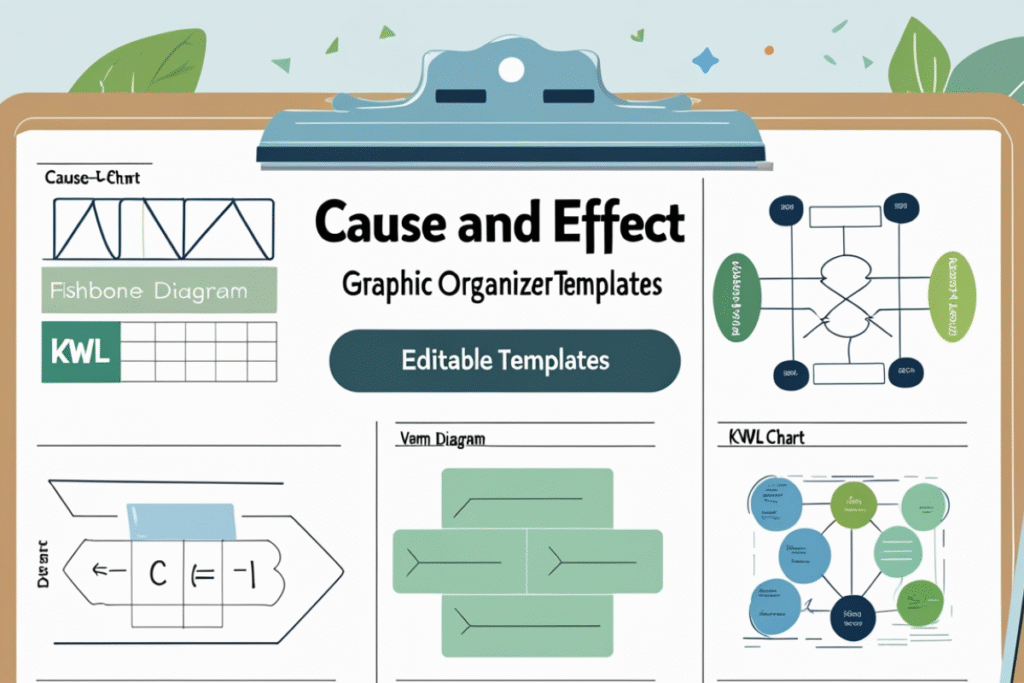
Types of Cause and Effect Graphic Organizers
There are several types of cause and effect graphic organizers designed for different applications. Below are some commonly used formats:
T-Chart
A T-chart is a simple two column chart where the left side lists causes, and the right side lists corresponding effects. It is useful for straightforward relationships between events.
Fishbone Diagram (Ishikawa Diagram)
This diagram resembles a fish skeleton, where the “head” represents the main issue, and the “bones” represent different categories of causes. It is widely used in business and scientific analysis.
Flowchart
A flowchart displays a sequence of causes and effects in a logical order. It is great for tracking step-by-step processes or analyzing how one event leads to another.
Venn Diagram
A cause and effect Venn diagram compares two or more causes and their shared or distinct effects. This is useful in literature analysis and comparative studies.
KWL Chart
A KWL chart stands for “Know, Want to know, and Learned.” It helps students track their learning process and understand how causes lead to specific learning outcomes.
Looking for a Free Cause and Effect Graphic Organizer?
You’re in the right place! A cause and effect graphic organizer is an excellent resource that helps learners and professionals break down and understand complex relationships between events or ideas.
It lets you explore how certain causes lead to specific effects and even how effects might trace back to particular causes. It’s a clear, visual way to map out connections and patterns.
These organizers are great for classroom use, helping students grasp cause-and-effect concepts in writing, reading, science, and social studies. They’re also ideal for enhancing critical thinking and learning across subjects.
How to Use a Causes and Effect Graphic Organizer
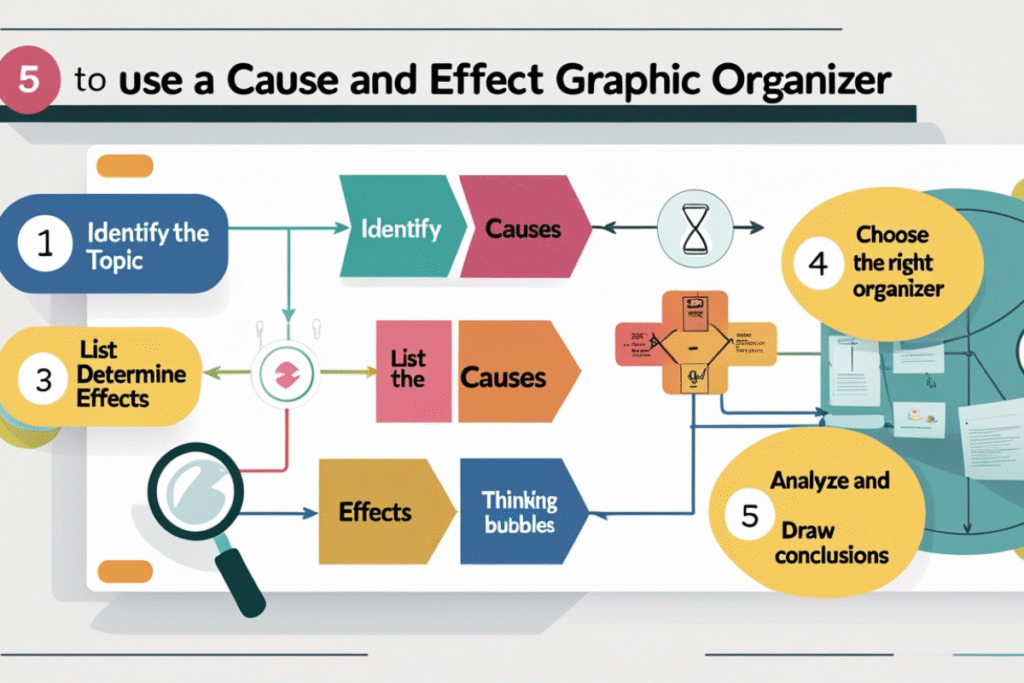
- Identify the Topic – Clearly define the cause or event you want to analyze.
- List the Causes – Write down all possible causes related to the event.
- Determine the Effects – Identify the effects that stem from each cause.
- Choose the Right Organizer – Depending on the complexity, select an appropriate cause and effect graphic organizer template (e.g., T-chart, flowchart, or fishbone diagram).
- Analyze and Draw Conclusions – Review patterns, relationships, and possible solutions.
How to Create a Cause and Effect Graphic Organizer
Select Your Topic
Clearly define the event or issue you want to analyze.
List All Possible Causes
Brainstorm different factors contributing to the event.
Identify the Effects
What outcomes or results occurred due to each cause?
Pick the Right Format
Choose a template based on the topic’s complexity (T-chart, fishbone, flowchart, etc.).
Draw Conclusions
Look for patterns, root causes, and deeper insights.
Download & Print It Couldn’t Be Easier!
Just click the dropdown arrow on the Download button to choose either a PDF or Google Slides version. Download your preferred format, print or edit as needed, and you’re all set! It’s a fast, effective, and organized way to start exploring cause and effect.
Examples of Cause of Graphic Organizers
Here are some real life examples where cause and effect graphic organizers are used:
- Education: A 5th-grade cause and effect graphic organizer helps students understand historical events, science concepts, and reading comprehension.
- Business Analysis: Editable cause and effect graphic organizers are used to analyze business failures and successes.
- Scientific Research: A cause and effect chart in a research paper helps visualize experimental outcomes.
- Environmental Studies: A pollution cause and effect graphic organizer helps students explore environmental issues.
Free Cause and Effect Graphics Organizer PDF and Templates
Looking for free cause and effect graphic organizer PDFs? You can download various templates, including:
- Editable PDF versions for digital use.
- Printable worksheets for classroom activities.
- Cause and effect graphic organizer PPT slides for presentations.
Tips for Making Cause and Effect Organizers More Effective
- Use visual cues like arrows and icons
- Color-code causes and effects for clarity
- Start with simple relationships before progressing to complex ones
- Include space for notes or reflections
- Encourage group work to brainstorm diverse causes and solutions
Conclusion
A cause and effect graphic organizer is a powerful visual tool that simplifies complex relationships between events, actions, and ideas.
Whether used in education, business, or research, these organizers enhance critical thinking, problem-solving, and comprehension by clearly mapping out cause-and-effect relationships.
With various types such as T charts, fishbone diagrams, and flowcharts, users can choose the most suitable format for their needs.
By utilizing these organizers, individuals can better analyze information, draw logical conclusions, and make informed decisions
FAQs
What is a graphic organizer for cause-and-effect?
A structured tool that visually represents the link between causes and effects.
What is a cause-and-effect organization example?
A T-chart listing causes of global warming and their effects, like rising temperatures.
How do you organize cause-and-effect?
Use a flowchart, fishbone diagram, or T-chart to map out relationships.
What are the five types of graphic organizers?
T-Chart, Fishbone Diagram, Flowchart, Venn Diagram, and KWL Chart.
What is a cause-and-effect pattern organizer?
A diagram that visually structures causes leading to specific outcomes.
What are cause and effect toys?
Educational toys like dominoes and pull-back cars that teach cause-effect logic.
How do businesses use cause and effect graphic organizers?
They analyze successes, failures, and problem-solving strategies.
Where can I find free cause and effect graphic organizers?
Downloadable PDFs, editable templates, and PowerPoint slides are available online.