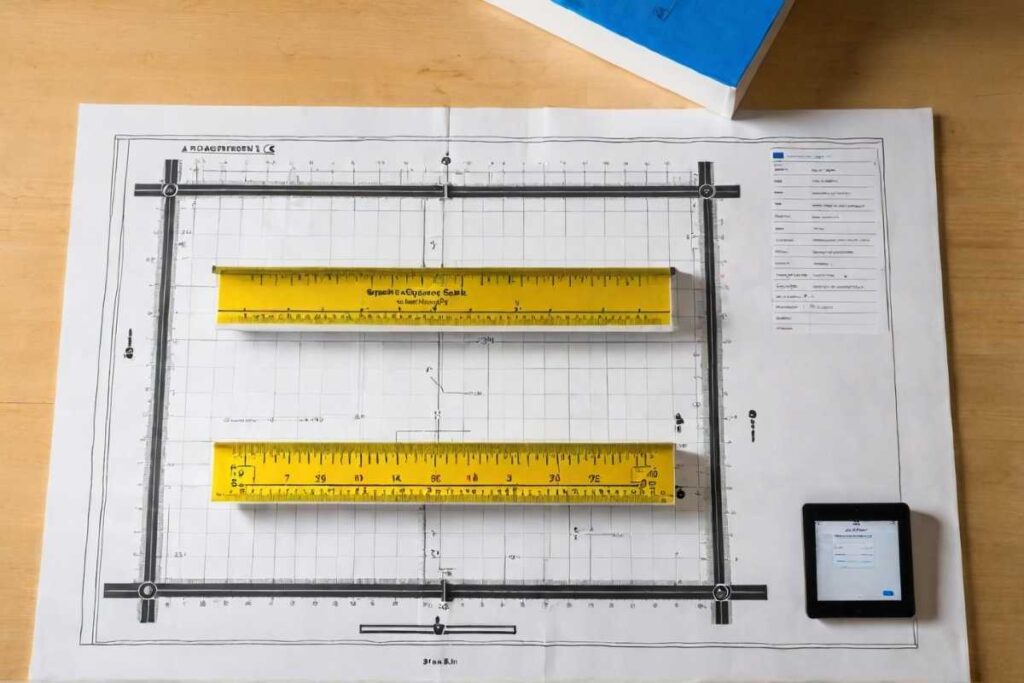
A graphic scale is a visual measurement tool that ensures precise proportions and accurate distances across maps, architectural plans and design projects. Unlike traditional numerical scales it offers an intuitive visual reference that makes interpreting dimensions faster and easier even for complex layouts.
Whether you’re planning cities, creating blueprints, designing layouts or working on detailed infographics, mastering graphic scales improves accuracy, saves time and enhances overall project efficiency.
In this comprehensive guide we’ll explore its types, real world applications and expert tips to use graphic scales effectively across every industry.
What Is a Graphic Scale?
A graphic scale is a visual method for representing proportions on maps, architectural drawings, and engineering plans.
It allows users to measure distances without relying solely on numerical ratios. Instead of expressing a ratio like 1:1500, it appears as a bar or line marked with units that correspond to real-world measurements.
Types of Scale Graphic
There are different types of graphic scales depending on the application:
- Linear Scale: A straight bar marked with units for measurement.
- Comparative Scale: Used for comparing two or more distances or sizes.
- Segmented Scale: Divided into sections for improved readability.
Each type serves a specific purpose in ensuring accurate representation in different industries.
Why Is It Important?
This makes it easier to interpret measurements accurately even if the document is printed, resized or viewed digitally. Graphic scales are essential for geography architecture and visual design because they maintain precision and clarity ensuring reliable proportional representation.
Graphic Scale in Geography
In maps, a graphic scale helps users determine distances between locations. It is typically placed at the bottom and shows distances in miles or kilometers.
This feature is widely used in applications like Google Earth, where precise distance comparison is essential.
Importance of Graphics Scales in Geography
- Ensures accurate measurement of distances on maps.
- Helps travelers and geographers estimate travel times.
- Assists in land surveying and territorial planning.
How to Read a Scale Graphic on a Map?
- Locate the scale bar at the bottom of the map.
- Identify the units of measurement (miles, kilometers, feet, etc.).
- Compare distances by using a ruler or your finger.
For example, if 1 inch equals 5 miles, then a 2-inch gap between two cities means the actual distance is 10 miles.
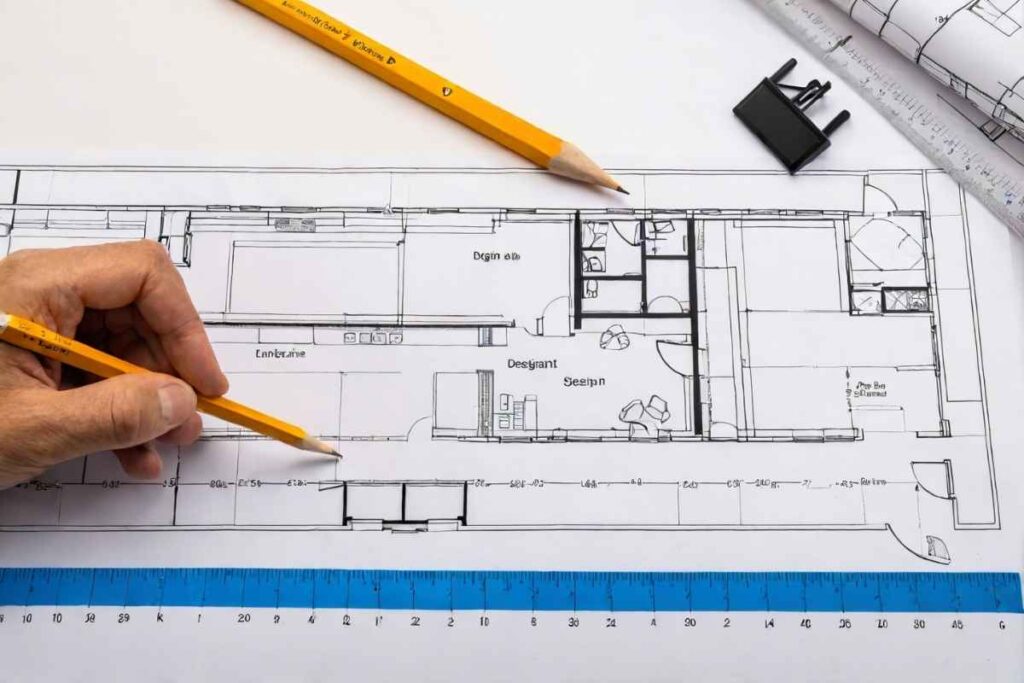
Graphic Scale in Architecture & Drawing
In architecture, scale graphic ensures that blueprints and plans maintain proportional accuracy. Commonly used ratios include:
- 1/8″ = 1’0″ – Found in floor plans.
- 1:1500 – Used for large-scale urban planning.
Tools like scale charts and specialized software help professionals create accurate drawings.
Commonly Used Scale Graphic Ratios in Architecture
- 1/8″ = 1’0″ – Found in floor plans.
- 1:1500 – Used for large-scale urban planning.
- 1:500 – Suitable for small building layouts.
Benefits of Using Graphic Scales in Architecture
- Ensures accurate representation of dimensions.
- Helps in visualizing spatial relationships in structures.
- Facilitates seamless communication between architects, engineers, and builders.
Tools like scale charts and specialized software help professionals create accurate drawings.
Graphic Scale in Graphic Design
Scale is crucial in design, influencing composition and hierarchy. Designers use varying sizes to direct attention to key elements, ensuring clarity and balance.
What Is a Scale in Graphic Design?
Scale refers to the relative size of different elements in a layout. For instance:
- A larger heading captures attention first.
- A smaller subtitle provides additional details.
- Images and icons maintain aesthetic balance.
How Scale Enhances Design
Aesthetic Balance – Ensures harmony in layout compositions.
Visual Emphasis – Larger elements grab attention.
Readability – Proper scaling improves content clarity.
What Is a Scale in Graphic Design?
Scale refers to the relative size of different elements in a layout. For instance:
- A larger heading captures attention first.
- A smaller subtitle provides additional details.
- Images and icons maintain aesthetic balance.
Graphic Scale Examples & Applications
1. Maps & Navigation
Mapping tools like Google Earth use scale graphic to measure distances accurately.
2. Architecture & Engineering
Blueprints rely on precise scaling for construction and planning.
3. Design & Visual Media
Scale enhances the readability and effectiveness of infographics and advertisements.
What Is a Graphic Rating Scale?
A graphic rating scale is used in performance evaluations to assess skills and attributes numerically, typically on a scale of 1 to 5.
Example of a Performance Rating Scale
| Performance Level | Rating |
|---|---|
| Excellent | 5 |
| Good | 4 |
| Average | 3 |
| Needs Improvement | 2 |
| Poor | 1 |
This method is widely used in business and education to evaluate competencies.
Advanced Tips for Accurate Scaling
To ensure the highest precision, always verify your graphic scale against a known measurement before applying it. This step prevents distortion caused by printer settings, screen size, or map resizing.
Professionals often double-check with digital tools to maintain exact proportions in critical projects.
Graphic Scals PDFs & Tools
Various resources are available online for creating standardized scales, including:
- Graphic chart PDFs for quick reference.
- Online scale generators for custom designs.
- Mobile apps for digital scaling solutions.
Popular Graphic Scale Tools
- AutoCAD – Commonly used for architectural drawings.
- Adobe Illustrator – Useful for designers working with scale-based projects.
- Google Earth Pro – Helps in geospatial scaling and measurements.
Conclusion
A graphic scale is more than a measuring aid it’s a universal visual language used across maps, architecture, engineering, and design. By converting complex ratios into clear visual bars it improves accuracy supports communication, and prevents scaling errors.
Whether you’re estimating distances on a map or drafting a building plan, using a graphic scale ensures every measurement stays true to real proportions. As digital tools evolve, graphic scales remain a foundation of precision and clarity in every visual project.
FAQs
What is a graphic scale?
A visual bar or line that represents real-world distances on maps, drawings, and plans.
How does it differ from a fractional scale?
A graphic scale offers a visual reference, while a fractional scale expresses a numerical ratio.
Where is it commonly used?
It is widely applied in mapping, architecture, engineering, and design.
How do you read it on a map?
Compare the marked scale bar with distances using a ruler or your finger.
What are common architectural scale ratios?
Examples include 1/8″ = 1’0″ for floor plans and 1:1500 for urban maps.
How is scale used in design?
Scale helps create hierarchy and focus within layouts, infographics, and user interfaces.
What is a graphic rating scale?
It is a tool for evaluating performance or attributes using a numerical rating system.
Where can I find resources for Scale graphic?
Online tools, PDFs, and apps provide templates for different professional needs.
How can I create a custom graphic scale?
Use software like AutoCAD or Illustrator to draw a bar with accurate unit divisions.
Can a graphic scale change with map resizing?
Yes. Always confirm the scale after printing or resizing to maintain accuracy.
Is a graphic scale suitable for digital-only projects?
Absolutely. Digital maps, infographics, and UI layouts all benefit from clear visual scaling.
What is a graphic scale used for?
It visually represents real-world distances on maps, plans, and drawings to ensure accurate measurements.
How is a graphic scale different from a numerical scale?
A graphic scale is visual and remains accurate even if resized, while a numerical scale depends on exact ratios like 1:1000.
Where are graphic scales commonly used?
They are used in geography, architecture, city planning, design, and engineering projects.
Can a graphic scale change if printed or resized?
Yes, resizing can distort it, so always verify the scale after printing or exporting.